Introduction
In today’s digital age, web applications play a critical role in our daily lives. Whether it’s online shopping, banking, or using social media, we rely heavily on web applications to perform seamlessly and efficiently. However, as the demand for these applications grows, so does the need to ensure they can handle the load without compromising performance. This is where load testing comes into play, and Apache JMeter stands out as a powerful tool for the job. In this comprehensive guide, we’ll explore how to use JMeter to optimize the performance of your web applications.
Quality means doing it right even when no one is looking – Henry Ford
Understanding the Importance of Performance Testing
Before delving into the specifics of JMeter, it’s essential to understand why performance testing is crucial for web applications.
1. User Experience :
A slow or unresponsive web application can frustrate users and lead to a poor user experience. With countless alternatives available, users are unlikely to stick around if your application doesn’t perform well.
2. Business Impact :
Performance issues can have a significant impact on your business. Slow loading times can lead to reduced user engagement, decreased conversion rates, and ultimately, lost revenue.
3. Scalability :
As your user base grows, your application should be able to scale to meet increased demand. Performance testing helps you identify bottlenecks and optimize your application’s scalability.
4. Reliability:
Reliable applications build trust with users. Load testing helps uncover potential issues before they impact users, enhancing the reliability of your application.
Introduction to Apache JMeter
Apache JMeter is an open-source, Java-based tool designed for load testing and performance measurement. It allows you to simulate various scenarios, such as multiple users accessing your application simultaneously, to assess its performance under different conditions. JMeter is a versatile tool that can be used for a wide range of performance testing tasks, including:
Load Testing: Simulating a specific number of concurrent users to determine how well your application handles the load
Stress Testing: Pushing your application to its limits to identify its breaking point.
Functional Testing: Verifying that your application functions correctly under various conditions.
Distributed Testing: Scaling your tests by distributing them across multiple machines.
Continuous Integration: Integrating JMeter into your CI/CD pipeline for automated testing.
Let’s dive into the practical aspects of using JMeter to optimize the performance of your web application.
How JMeter work?
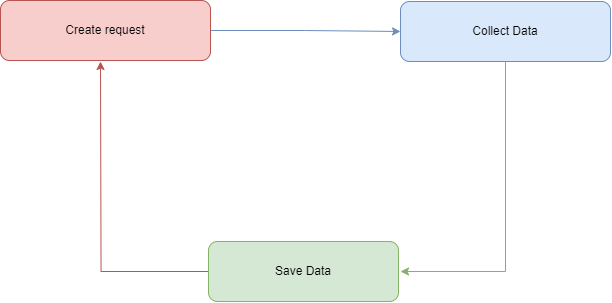
JMeter works at the Protocol level simulating network requests.
JMeter is not a browser it doen’t execute Javascript.
Simulate Users

JMeter Test Execution

Hardware and Software Requirements
Prior to delving into the installation process, let’s begin by addressing the hardware and software requirements.
Hardware Requirements
1. CPU
To run JMeter smoothly and efficiently, you should have a CPU with at least 4 cores. This will allow JMeter to handle the load testing tasks effectively, ensuring accurate and reliable results.
2. Memory (RAM)
Ideally, your system should be equipped with a minimum of 16 GB of RAM. Having sufficient memory is essential for JMeter to handle large-scale tests and simulate numerous virtual users without experiencing performance bottlenecks.
3. Network
A Gigabit Ethernet connection is highly recommended. A fast and stable network connection is vital when conducting distributed load tests or testing web applications with high concurrency.
Software Requirements
1. Java
JMeter is a Java-based application, and it relies on Java Virtual Machine (JVM) to run. Therefore, you must have Java installed on your system. JMeter supports various Java versions, so ensure that you have a compatible Java version for your JMeter installation. Different versions of JMeter may have specific Java version requirements, so be sure to check the documentation for your specific JMeter version.
Operating System Compatibility:
JMeter can be installed on various operating systems, including Windows, Linux, and macOS, as long as they support the required Java version.
Installation
To begin, you’ll need to download and install JMeter from the
official Apache JMeter website. JMeter is a Java-based application, so you’ll need to have Java installed on your machine.
Creating a Test Plan
In JMeter, everything starts with a test plan. A test plan is a container that holds all the elements of your test, including thread groups, samplers, controllers, and listeners. It is basically the root element of any test.
Thread Group
A thread group represents a group of virtual users who will interact with your application. It defines the number of users, the ramp-up period, and the loop count.
Ramp-up period :
The ramp-up period in JMeter controls how fast it adds threads. Imagine you have 10 threads and a 100-second ramp-up. It means JMeter will take 100 seconds to start all 10 threads. Each thread begins 10 seconds after the previous one. With 30 threads and a 120-second ramp-up, each new thread starts 4 seconds later than the previous one.
Controllers
Controllers provide logic for your test plan. For example, you can use a Loop Controller to specify how many times a group of requests should be executed.
There are two types of Controllers :
- Logic Controller
- Samplers
Logic Controller
Let us customize the logic to decide when to send requests. Logic controllers can change the order of a request coming from any of their child elements.
| Simple Controller |
If Controller |
| Loop Controller |
While Controller |
| Once Only Controller |
ForEach Controller |
| Switch Controller |
Recording Controller |
Sampler
Samplers serve as the core components of your test plan, functioning as the driving force behind it. They are responsible for dispatching requests to web applications, thereby emulating user interactions. In essence, samplers either execute a single request or initiate a sequence of one or more requests.
JMeter offers support for a variety of samplers, which encompass HTTP requests, FTP requests, and JDBC requests, among others. The following table provides a list of these samplers for your reference:
| Graph Results |
View Results in Table |
| Spline Visualizer |
Simple Data Writer |
| Assertion Results |
Monitor Results |
| View Results Tress |
Aggregate Graph |
Listeners
Listeners display the results of your test. JMeter offers a range of listeners, such as View Results Tree, Summary Report, and Response Times Over Time.
The following table summarizes a list of these Listeners for your reference:
| Graph Results |
View Results in Table |
| Spline Visualizer |
Simple Data Writer |
| Assertion Results |
Monitor Results |
| View Results Tree |
Aggregate Graph |
Import Points about Listeners
- All Listeners save the data the only difference is the way of data is presented.
- Listeners can use a lot of memory.
Assertions
Assertions are used to verify that the application behaves as expected. For example, you can add a Response Assertion to check if a specific text or element exists on a page.
The following table provides a list of these Assertions for your reference:
| Response Assertion |
Duration Assertion |
| HTML Assertion |
Size Assertion |
| Compare Assertion |
XML Assertion |
| XPath Assertion |
BeanShell Assertion |
Configuration Elements
Configuration Elements allow to creation of defaults and variables to be used by Samplers. They are used to add or modify requests made by Samplers.
The following table provides a list of these Configuration Elements for your reference:
| HTTP Authorization |
JDBC Connection |
| HTTP Cache Manager |
Login Config Element |
| HTTP Cookie Manager |
LDAP Request Defaults |
| HTTP Proxy Server |
HTTP Request Defaults |
Pre-Processor Elements
A Pre-Processor is like a helper that gets things ready before sending a request during performance testing. It can do tasks like setting variables, reading data from files, or modifying URLs. It prepares the ground for your test to run smoothly.
The following table provides a list of these Configuration Elements for your reference:
| JDBC PreProcessor |
HTML Link Parser |
| User Parameters |
HTTP URL Re-writing |
| HTTP User Parameter |
RegEx User Parameter |
Post-Processor Elements
A Post-Processor, on the other hand, steps in after a request has been made and the server responds. It’s like a detective that examines the response, searching for valuable information. It can extract data, check for errors, or perform specific actions based on what the server says. Post-processors help you make sense of the results and take action accordingly.
The following table provides a list of these Configuration Elements for your reference:
| Regular Expression |
JDBC PostProcessors |
| XPath Extractor |
BeanShell PostProcessor |
| CSS/JQuery Extractor |
Debug PostProcessor |
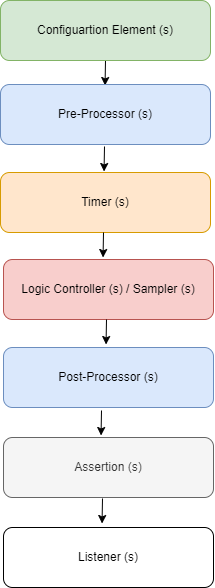
JMeter Execution Order
Here, we present a visual representation of the JMeter execution order in the form of an image.

Recording Tests
JMeter provides a built-in proxy server that allows you to record user interactions with your web application. To record a test:
Set up the JMeter proxy server
Configure your browser to use JMeter as a proxy. Browse your web application while JMeter records the interactions.
This approach is particularly useful for capturing real-world scenarios.
Running Tests
Once you’ve created your test plan, you can run your tests. JMeter will simulate user interactions based on your configuration and provide detailed reports.
Analyzing Results
Analyzing test results is a crucial step in optimizing performance. JMeter’s listeners generate reports that include response times, error rates, and other performance metrics. Use these reports to identify bottlenecks and areas for improvement.
Advanced JMeter Techniques
While the basics of JMeter are relatively straightforward, it’s a powerful tool with many advanced features.
1. Parameterization
Parameterization allows you to vary the data sent in your requests. For example, you can use CSV Data Set Config to read data from a CSV file and use it in your requests. This is useful for testing different scenarios with varying input data.
2. Distributed Testing
Distributed testing involves running your tests on multiple machines to simulate a larger load. JMeter supports distributed testing, allowing you to scale your tests as needed.
3. Continuous Integration
Integrating JMeter into your CI/CD pipeline ensures that performance testing is part of your development process. You can use plugins like the Performance Plugin for Jenkins to automate JMeter tests.
4. Scripting
For advanced scenarios, you can use JMeter’s built-in scripting capabilities. JMeter supports BeanShell and JavaScript scripting for customizing your tests.
Best Practices for JMeter Load Testing
To get the most out of JMeter and ensure accurate performance testing, follow these best practices:
1. Start Simple
Begin with basic test scenarios to understand how JMeter works. Once you’re comfortable, gradually add complexity to your tests.
2. Monitor System Resources
Keep an eye on the system resources (CPU, memory, disk I/O) of the machine running JMeter. Resource limitations can affect test results.
3. Use Timers Wisely
Timers allow you to control the pacing of your tests. Use them to simulate real user behavior, but avoid excessive delays that could skew results.
4. Regularly Review and Refine Tests
As your application evolves, revisit your test plans and update them to reflect changes in functionality.
5. Secure Your Tests
Ensure that your tests do not contain sensitive data or credentials that could be exposed in logs or reports.
Conclusion
Optimizing the performance of your web applications is essential for delivering a seamless user experience and ensuring the success of your business. Apache JMeter is a versatile and powerful tool that empowers you to conduct load testing and identify performance bottlenecks.
By following the steps outlined in this comprehensive guide, you’ll be well-equipped to use JMeter effectively, run performance tests, and fine-tune your web applications for optimal performance. Remember that performance optimization is an ongoing process, and regular testing and monitoring are key to maintaining a high-performing web application.
Start load testing with JMeter today and ensure that your web applications can handle the demands of your users effectively and efficiently.


